An Interactive Guide to Count-Min Sketch
Learn Count-Min Sketch: a probabilistic data structure for estimating item frequency in data streams, featuring an interactive guide and demo

Introduction
A Count-Min Sketch is a probabilistic data structure that estimates the frequency of events or items in a massive data stream. While HyperLogLog estimates the total number of distinct items (cardinality), a Count-Min Sketch estimates how many times each specific item occurs (frequency). Even when you are processing an unbounded, massive stream of data where you cannot store every item, a Count-Min Sketch lets you track frequencies using fixed, sub-linear memory.
Working Principle
This blog is the third installment in my probabilistic data structures series. I have written similar interactive guides on Bloom Filter and HyperLogLog.
-
Structure of a Count-Min Sketch:
-
A 2D array of counters with
drows (depth) andwcolumns (width). -
Each of the
drows has its own independent hash function ().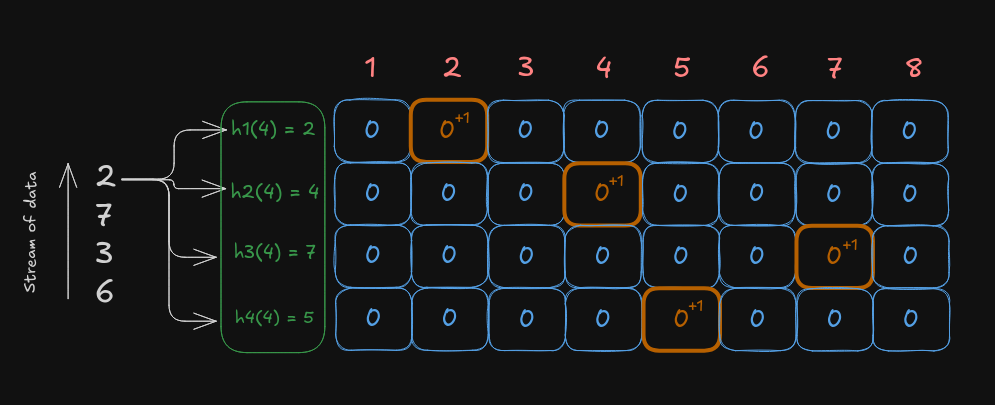
-
-
Insert Operation (Adding an item):
-
For an item
x, compute its hash value using alldhash functions. -
For each row
i, increment the corresponding counter athash_i(x):Pythoncount[i][hash_i(x)] += 1
-
-
Query Operation (Getting frequency estimate of
x):-
Hash
xwith the samedhash functions. -
Fetch the counter values from each row at their respective hashed positions.
-
Return the minimum value among those
dcounters:Pythonestimate = min(count[0][h1(x)], count[1][h2(x)], ..., count[d-1][hd(x)])
-
I have created an interactive app that lets you visualize how a Count-Min Sketch operates:
- Adjust the number of rows and columns.
- Click to generate a random number. The number is hashed
dtimes, finding the cell in each row that gets incremented by 1. - Querying follows a similar process: we hash the item, inspect all
dmatching cells, and take their minimum value to obtain the frequency estimate.
Can you configure the parameters so the Count-Min Sketch always gets the estimate right?
Key Insights
-
Why "Count-Min"? It counts frequencies and returns the minimum value across independent hash estimates. The "sketch" refers to a compact summary of a large dataset.
-
Sub-linear space complexity: It requires fixed memory proportional to , regardless of how many billions of events stream in.
-
No underestimation: A Count-Min Sketch never underestimates the true frequency. Counters are only incremented, so hash collisions can only artificially inflate a counter, never decrease it. Taking the minimum across independent rows minimizes this collision noise.
-
Tuning
d(Depth/Rows): Increasingdreduces the probability of high error because it provides more independent hash estimates, at the cost of slightly more hashing computation per item. -
Tuning
w(Width/Columns): Increasingwreduces the probability of hash collisions, leading to tighter error bounds at the cost of more memory.
Interactive Demo
I have created an interactive demo that puts all the pieces together. In this demo, the sketch estimates the frequency of fruits in a stream of 5,000 items. Hit Start to watch the stream of fruits process in real-time, and observe how the sketch never underestimates the true count.
Mathematical Relationships
Error Bounds
-
The error in frequency estimation satisfies: with probability at least .
-
Where:
-
= error factor (e.g., represents a error tolerance)
-
= total number of items processed in the stream
-
= failure probability (e.g., gives confidence)
-
Formula for Parameters
-
Width: (where )
-
Depth:
Use Cases
-
Heavy Hitters / Top-K Elements: Identifying the most frequent items, trending hashtags, or most popular products in high-volume streams.
-
DDoS and Anomaly Detection: Detecting IP addresses generating an abnormal volume of requests in network switches and firewalls.
-
Search Engines: Tracking popular search terms and autocomplete suggestions in real-time without storing every individual query.