Instrument Your Node.js App With OpenTelemetry
Learn how to instrument a Node.js and NestJS application using OpenTelemetry and Jaeger for distributed tracing and debugging

Introduction
Have you ever encountered a production bug where your logs couldn't explain what went wrong, or a critical API request that took unusually long to complete?
Debugging these issues across microservices and complex backends without a dedicated tracing system is frustrating and time-consuming. Distributed tracing acts like a CCTV camera for your architecture: it records what happened, when it happened, the sequence of operations, and exactly how long each step took. This visibility is vital for troubleshooting failures and diagnosing performance bottlenecks in modern systems.
Prerequisites
- Node.js (v18+)
- TypeScript
- NestJS
- Docker and Docker Compose
Key Concepts and Terminology
-
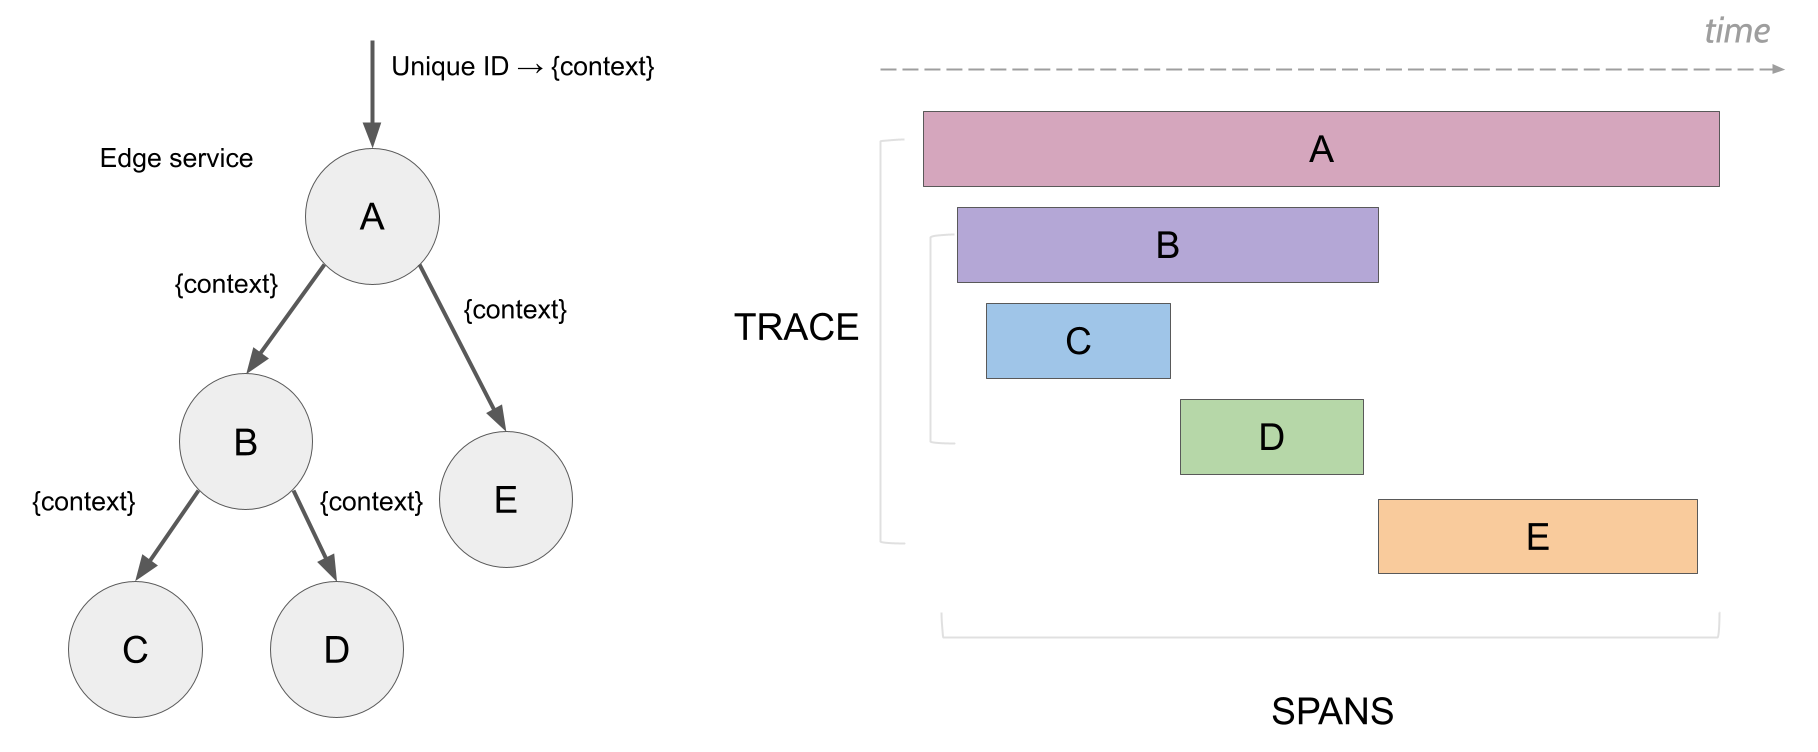
Trace: A trace represents the complete end-to-end journey of a single request as it traverses your distributed system. Think of it as a detailed travel log recording every stop, database query, and external API call from entry to exit.
-
Span: The fundamental building block of a trace. A span represents a single contiguous unit of work (e.g., executing an HTTP request or running an SQL query):
-
Root Span: The top-level span that initiates the trace when the request enters the first service.
-
Child Span: A nested span representing a sub-operation executed within the context of a parent span.
-
-
Instrumentation: The process of integrating telemetry code into your application to measure runtime performance and record spans.
-
Context Propagation: The mechanism for passing trace identifiers (such as Trace ID and Span ID) across service boundaries and HTTP headers so downstream services correlate their work with the same trace.
-
Exporter: An OpenTelemetry component that batches and transmits recorded trace spans over the network (e.g., via OTLP/HTTP or gRPC) to a storage and visualization backend like Jaeger.
-
Metrics: Numerical values aggregated over time (e.g., request rate, error counts, CPU usage) to monitor overall application health.
-
Logs: Timestamped text records describing discrete events occurring within the application.
The Three Pillars of Observability
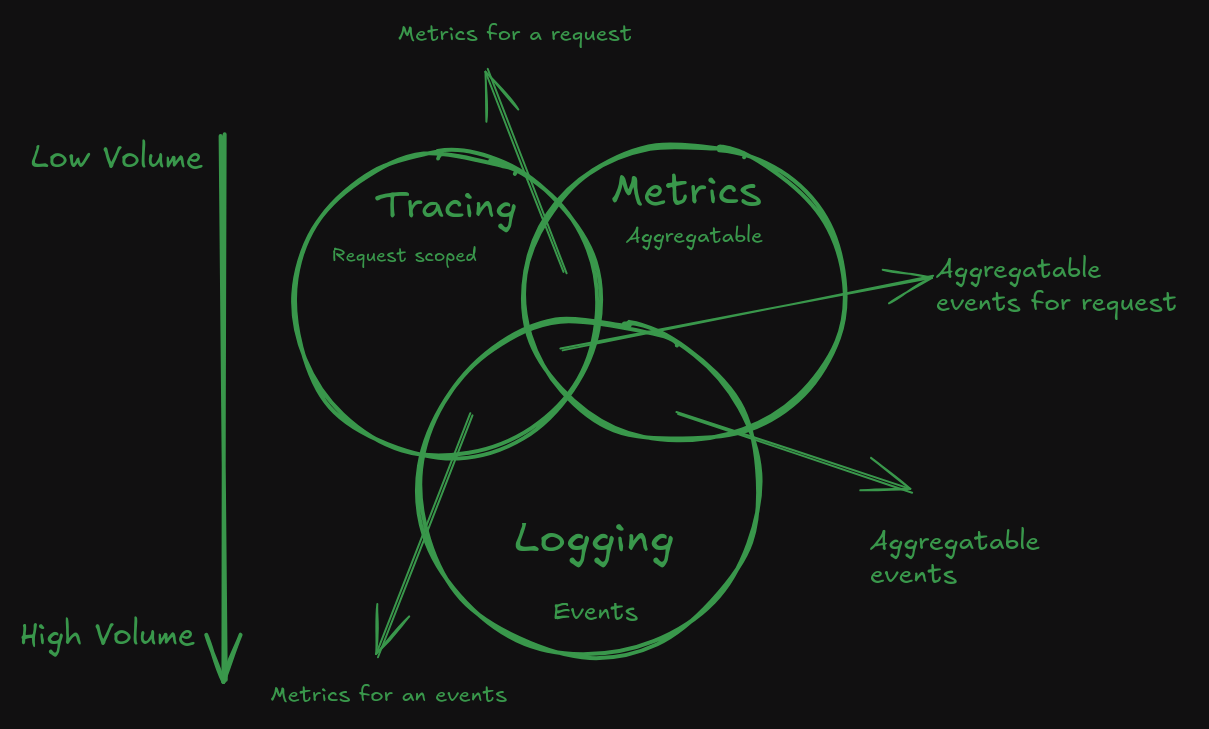
Observability enables you to understand the internal state of a system based solely on its external outputs. It equips engineering teams to diagnose not just known failure modes, but also "unknown unknowns" by answering the fundamental question: “Why is this happening?”
Setting Up the NestJS Project
Create a new NestJS project using the CLI:
pnpm i -g @nestjs/cli
nest new tracing-app
cd tracing-app
Installing Dependencies
Install the required OpenTelemetry and Jaeger packages:
pnpm install @opentelemetry/sdk-trace-node @opentelemetry/resources @opentelemetry/sdk-trace-base
pnpm install @opentelemetry/instrumentation @prisma/instrumentation @opentelemetry/instrumentation-net @opentelemetry/instrumentation-http @opentelemetry/instrumentation-express
pnpm install @opentelemetry/exporter-trace-otlp-http
pnpm install @opentelemetry/api @opentelemetry/semantic-conventions
Install Prisma ORM, SQLite driver, and Swagger documentation support:
pnpm install @prisma/client sqlite3 class-validator
pnpm install prisma --save-dev
pnpm install @nestjs/swagger
Initialize Prisma in the project:
npx prisma initThis generates a prisma directory with a schema.prisma configuration file. Update it as follows:
datasource db {
  provider = "sqlite"
  url      = "file:./dev.db"
}

generator client {
  provider = "prisma-client-js"
}

model User {
  id    Int     @id @default(autoincrement())
  name  String
  email String  @unique
}
Run initial migrations and generate the Prisma Client:
npx prisma migrate dev --name init
npx prisma generate
Creating CRUD Endpoints
Generate a CRUD resource for users using the NestJS CLI:
pnpm nest generate resource usersCreate a prisma.service.ts file in the src/prisma/ folder to manage the database connection lifecycle:
import { Injectable, OnModuleInit, OnModuleDestroy } from '@nestjs/common';
import { PrismaClient } from '@prisma/client';

@Injectable()
export class PrismaService extends PrismaClient implements OnModuleInit, OnModuleDestroy {
  async onModuleInit() {
    await this.$connect();
  }

  async onModuleDestroy() {
    await this.$disconnect();
  }
}
Update users.module.ts to register PrismaService:
import { Module } from '@nestjs/common';
import { UsersService } from './users.service';
import { UsersController } from './users.controller';
import { PrismaService } from '../prisma/prisma.service';

@Module({
  controllers: [UsersController],
  providers: [UsersService, PrismaService],
})
export class UsersModule { }
Create a DTO file named create-user.dto.ts in the src/users/dto/ directory:
import { IsEmail, IsNotEmpty, IsString } from 'class-validator';
import { ApiProperty, PartialType } from '@nestjs/swagger';

export class CreateUserDto {
    @ApiProperty({
        description: 'The name of the user',
        example: 'John Doe',
    })
    @IsNotEmpty()
    @IsString()
    name: string;

    @ApiProperty({
        description: 'The email of the user',
        example: 'email@domain.com',
    })
    @IsNotEmpty()
    @IsEmail()
    email: string;
}

export class UpdateUserDto extends PartialType(CreateUserDto) {}
Implement the business logic in src/users/users.service.ts:
import { Injectable } from '@nestjs/common';
import { PrismaService } from '../prisma/prisma.service';
import { CreateUserDto } from './dto/create-user.dto';
import { UpdateUserDto } from './dto/update-user.dto';

@Injectable()
export class UsersService {
  constructor(private prisma: PrismaService) {}

  create(createUserDto: CreateUserDto) {
    return this.prisma.user.create({
      data: createUserDto,
    });
  }

  findAll() {
    return this.prisma.user.findMany();
  }

  findOne(id: number) {
    return this.prisma.user.findUnique({
      where: { id },
    });
  }

  update(id: number, updateUserDto: UpdateUserDto) {
    return this.prisma.user.update({
      where: { id },
      data: updateUserDto,
    });
  }

  remove(id: number) {
    return this.prisma.user.delete({
      where: { id },
    });
  }
}
Update the src/users/users.controller.ts file with Swagger annotations:
import { Controller, Get, Post, Body, Patch, Param, Delete } from '@nestjs/common';
import { UsersService } from './users.service';
import { CreateUserDto } from './dto/create-user.dto';
import { UpdateUserDto } from './dto/update-user.dto';
import { ApiGoneResponse, ApiNotFoundResponse, ApiOkResponse, ApiOperation, ApiParam, ApiTags } from '@nestjs/swagger';

@ApiTags('users')
@Controller('users')
export class UsersController {
  constructor(private readonly usersService: UsersService) { }

  @ApiOperation({ summary: 'Create user' })
  @ApiOkResponse({ description: 'User created' })
  @Post()
  create(@Body() createUserDto: CreateUserDto) {
    return this.usersService.create(createUserDto);
  }

  @ApiOperation({ summary: 'Get all users' })
  @ApiOkResponse({ description: 'Users found' })
  @Get()
  findAll() {
    return this.usersService.findAll();
  }

  @ApiOperation({ summary: 'Get user by id' })
  @ApiOkResponse({ description: 'User found' })
  @ApiNotFoundResponse({ description: 'User not found' })
  @ApiParam({ name: 'id', description: 'User id' })
  @Get(':id')
  findOne(@Param('id') id: string) {
    return this.usersService.findOne(+id);
  }

  @ApiOperation({ summary: 'Update user' })
  @ApiOkResponse({ description: 'User updated' })
  @ApiNotFoundResponse({ description: 'User not found' })
  @ApiParam({ name: 'id', description: 'User id' })
  @Patch(':id')
  update(@Param('id') id: string, @Body() updateUserDto: UpdateUserDto) {
    return this.usersService.update(+id, updateUserDto);
  }

  @ApiOperation({ summary: 'Delete user' })
  @ApiGoneResponse({ description: 'User deleted' })
  @ApiParam({ name: 'id', description: 'User id' })
  @Delete(':id')
  remove(@Param('id') id: string) {
    return this.usersService.remove(+id);
  }
}
Configuring OpenTelemetry and Exporters
Create a file named tracing.ts in your src/ directory to configure the OpenTelemetry Node SDK and automatic instrumentations:
import { ATTR_SERVICE_NAME, ATTR_SERVICE_VERSION } from '@opentelemetry/semantic-conventions';
import { BatchSpanProcessor } from '@opentelemetry/sdk-trace-base';
import { ExpressInstrumentation } from '@opentelemetry/instrumentation-express';
import { HttpInstrumentation } from '@opentelemetry/instrumentation-http';
import { NetInstrumentation } from '@opentelemetry/instrumentation-net';
import { NodeTracerProvider } from '@opentelemetry/sdk-trace-node';
import { OTLPTraceExporter } from '@opentelemetry/exporter-trace-otlp-http';
import { PrismaInstrumentation } from '@prisma/instrumentation';
import { Resource } from '@opentelemetry/resources';
import { diag, DiagConsoleLogger, DiagLogLevel } from '@opentelemetry/api';
import { registerInstrumentations } from '@opentelemetry/instrumentation';

export function setupTracing() {
    // Enable OpenTelemetry diagnostic logging for troubleshooting
    diag.setLogger(new DiagConsoleLogger(), DiagLogLevel.INFO);

    // Create a resource describing your service
    const resource = new Resource({
        [ATTR_SERVICE_NAME]: process.env.SERVICE_NAME || 'tracer-app',
        [ATTR_SERVICE_VERSION]: process.env.npm_package_version || '1.0.0',
    });

    // Configure OTLP exporter pointing to Jaeger or an OpenTelemetry Collector
    const otlpExporter = new OTLPTraceExporter({
        url: process.env.OTEL_EXPORTER_OTLP_ENDPOINT || 'http://localhost:4318/v1/traces',
    });

    // Create tracer provider with resource metadata and a batch span processor
    const provider = new NodeTracerProvider({
        resource,
        spanProcessors: [
            new BatchSpanProcessor(otlpExporter, {
                maxQueueSize: 100,
                scheduledDelayMillis: 5000,
                exportTimeoutMillis: 30000,
                maxExportBatchSize: 50,
            })
        ]
    });

    // Register auto-instrumentations for HTTP, Express, and Prisma
    registerInstrumentations({
        tracerProvider: provider,
        instrumentations: [
            new HttpInstrumentation({
                requestHook: (span, request) => {
                    span.setAttribute('http.request.method', request.method);
                },
            }),
            new NetInstrumentation(),
            new ExpressInstrumentation(),
            new PrismaInstrumentation({ middleware: true }),
        ],
    });

    // Register the tracer provider globally
    provider.register();

    return provider;
}

// Call this at application startup before bootstrapping NestJS
setupTracing();
Breakdown of the Configuration
-
Diagnostic Logging: Logs OpenTelemetry internal events to the console at
INFOlevel to simplify debugging and confirm initialization. -
Resource Initialization: Attaches metadata (like
service.nameandservice.version) to all emitted spans, enabling filtering by service in Jaeger. -
OTLP Trace Exporter: Configures the OpenTelemetry Protocol (OTLP) exporter to send trace batches via HTTP (port
4318). You can easily point this to other backends like Honeycomb, Datadog, or Grafana Tempo, or switch to the higher-performance gRPC exporter (port4317). -
BatchSpanProcessor: Buffers spans in memory and exports them asynchronously in batches to minimize runtime overhead on API requests.
-
Auto-Instrumentation: Automatically intercepts inbound/outbound calls:
-
HttpInstrumentation: Traces incoming HTTP requests and outgoing HTTP client calls. -
ExpressInstrumentation: Captures route matching and middleware execution time. -
PrismaInstrumentation: Records duration and queries generated by Prisma database operations.
-
Initializing Tracing in Your Application
Import the tracing setup as the very first line of your src/main.ts file before any NestJS modules are imported:
import './tracing';
import { NestFactory } from '@nestjs/core';
import { SwaggerModule, DocumentBuilder } from '@nestjs/swagger';
import { AppModule } from './app.module';

async function bootstrap() {
  const app = await NestFactory.create(AppModule);

  const config = new DocumentBuilder()
    .setTitle('Tracing Example API')
    .setDescription('NestJS API instrumented with OpenTelemetry')
    .setVersion('1.0')
    .addTag('users')
    .build();
  const documentFactory = () => SwaggerModule.createDocument(app, config);
  SwaggerModule.setup('api-docs', app, documentFactory);

  await app.listen(process.env.PORT ?? 3000);
}
bootstrap();
Running Jaeger Locally
The easiest way to run Jaeger locally for development is with Docker Compose.
Create a docker-compose.yaml file:
services:
  jaeger:
    image: jaegertracing/all-in-one:1.63.0
    container_name: jaeger
    environment:
      COLLECTOR_OTLP_ENABLED: "true"
    ports:
      - "4317:4317"   # OTLP gRPC receiver
      - "4318:4318"   # OTLP HTTP receiver
      - "16686:16686" # Jaeger Web UI

networks:
  default:
    driver: bridge
Start Jaeger:
docker compose up -dRunning Your Application
Start your NestJS development server:
pnpm run start:devContainerizing the Application (Optional)
You can use the docker init command or the following multi-stage Dockerfile to package your application for production:
# Arguments for versions
ARG NODE_VERSION=20.18.0
ARG PNPM_VERSION=9.12.2
ARG ALPINE_VERSION=3.20

################################################################################
# Base stage: Build the application
FROM node:${NODE_VERSION}-alpine${ALPINE_VERSION} AS builder

# Set working directory
WORKDIR /usr/src/app

# Install pnpm globally with cache
RUN --mount=type=cache,target=/root/.npm \
    npm install -g pnpm@${PNPM_VERSION}

# Copy package manifests to install dependencies
COPY package.json pnpm-lock.yaml ./

# Install dependencies with cache
RUN --mount=type=cache,target=/root/.pnpm-store \
    pnpm install --frozen-lockfile

# Copy application source code
COPY . .

# Generate Prisma client and build application
RUN pnpm prisma generate
RUN pnpm run build

# Runner Stage
FROM node:${NODE_VERSION}-alpine${ALPINE_VERSION} AS runner

WORKDIR /usr/src/app

# Copy built application and production dependencies
COPY --from=builder /usr/src/app/dist ./dist
COPY package.json pnpm-lock.yaml ./
COPY prisma/schema.prisma ./prisma/schema.prisma

# Install pnpm globally and production dependencies
RUN --mount=type=cache,target=/root/.npm \
    npm install -g pnpm@${PNPM_VERSION}

RUN --mount=type=cache,target=/root/.pnpm-store \
    pnpm install --frozen-lockfile --prod

ENV NODE_ENV=production

CMD ["pnpm", "run", "start:prod"]
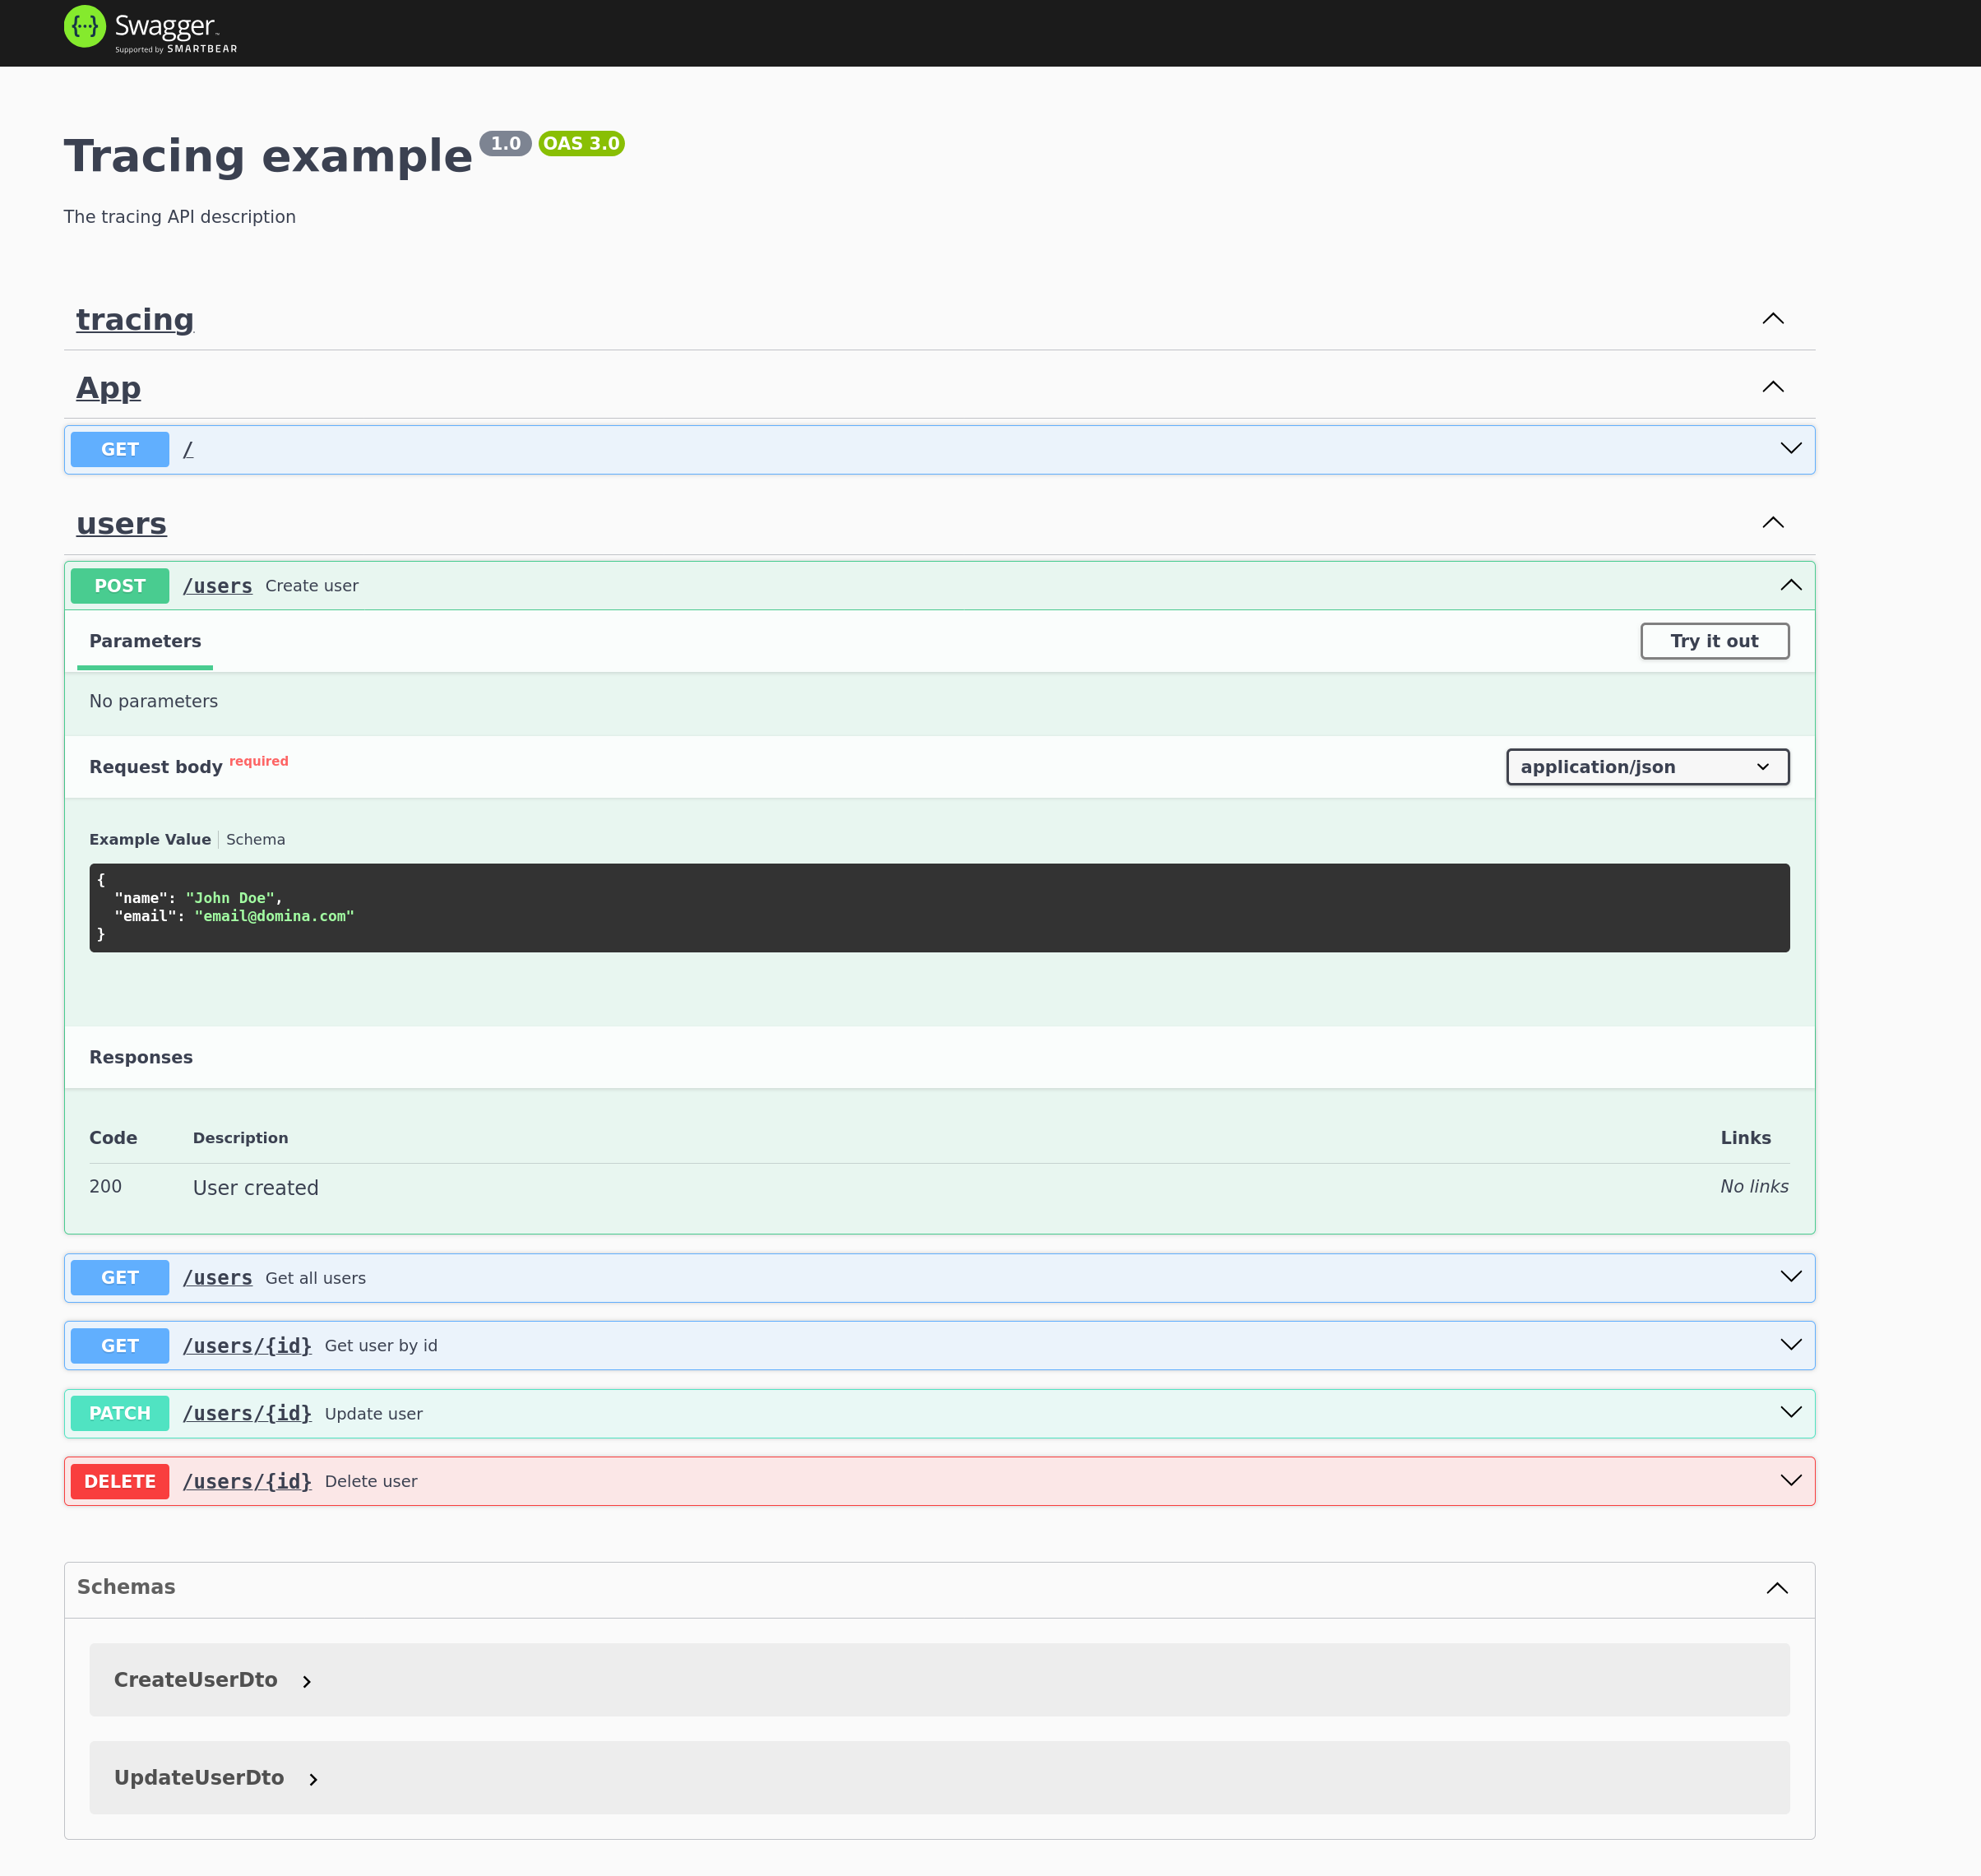
Testing with Swagger UI
Visit http://localhost:3000/api-docs in your browser and execute a few API requests (e.g., POST /users and GET /users):
Visualizing Traces in Jaeger
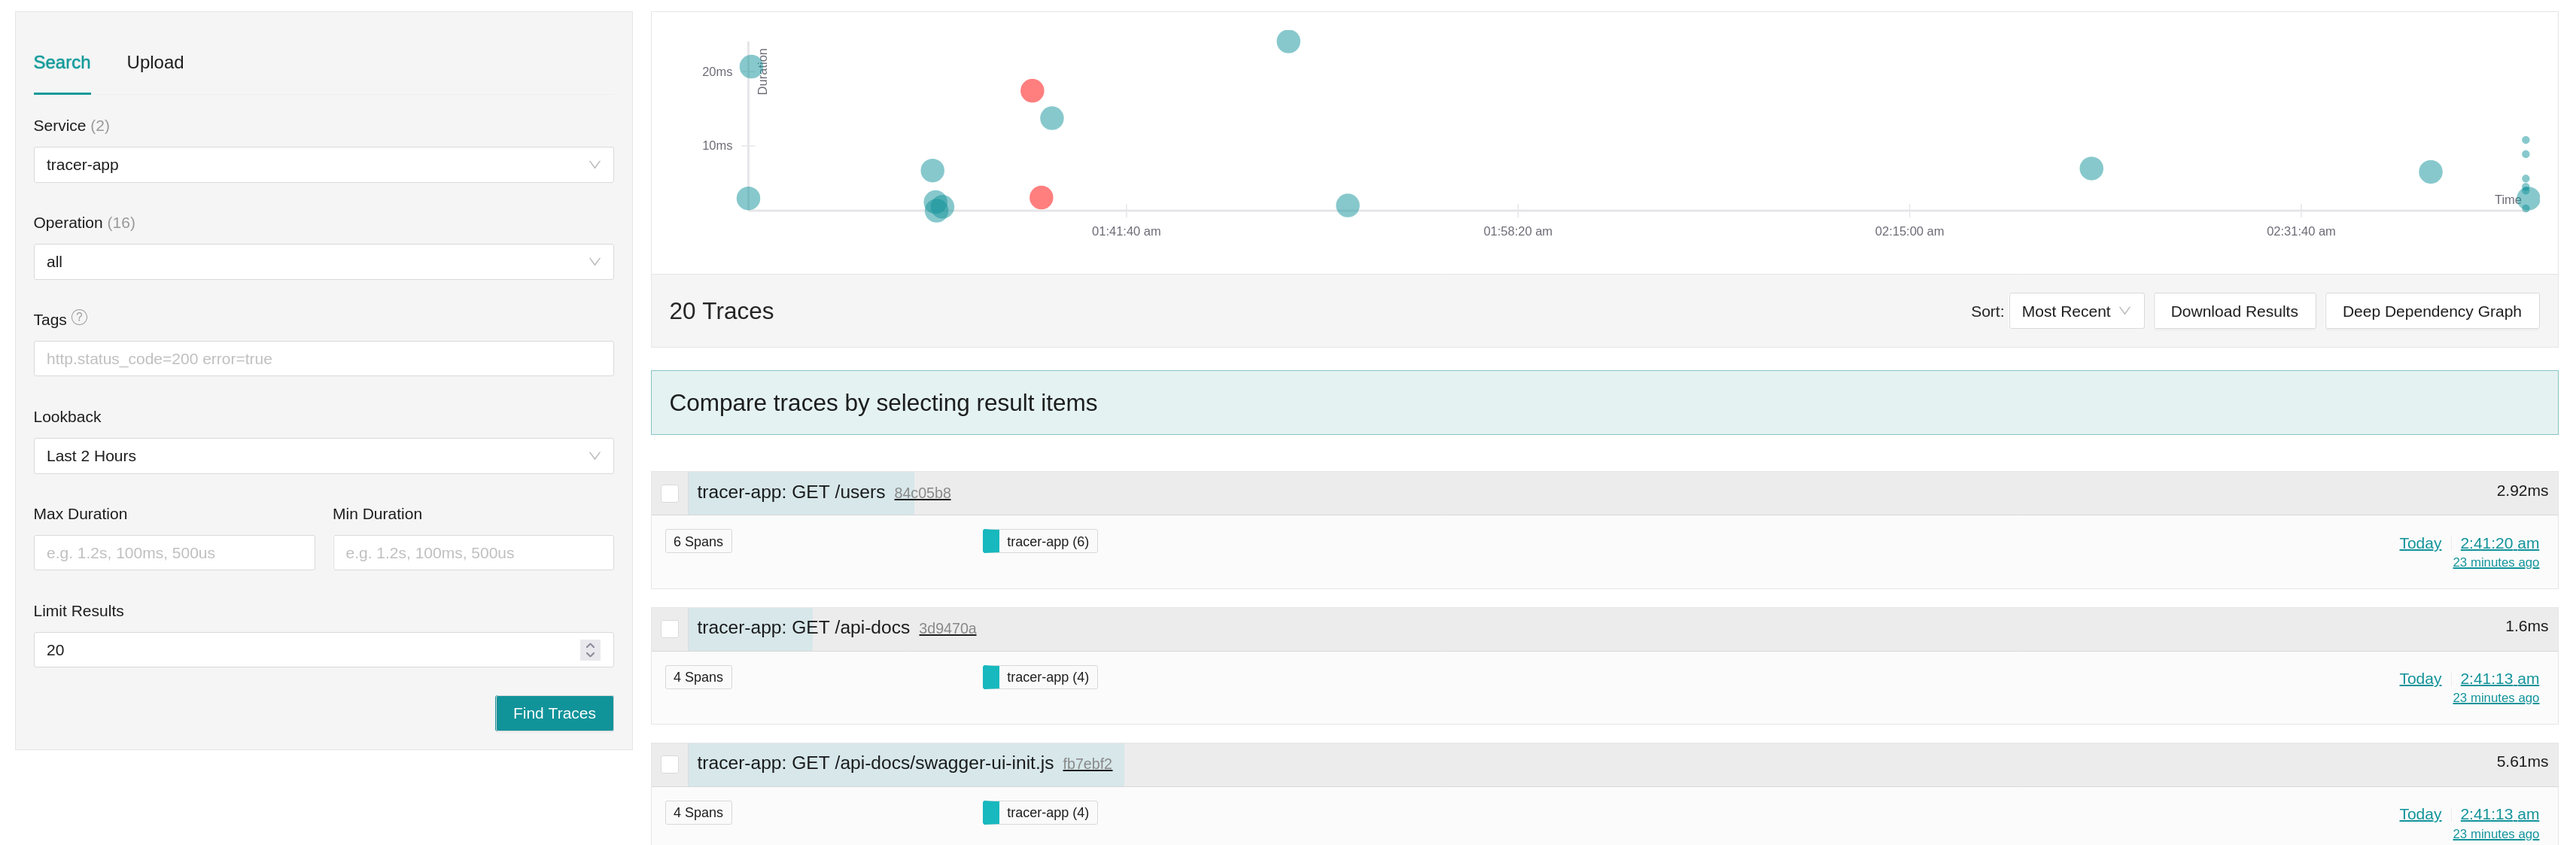
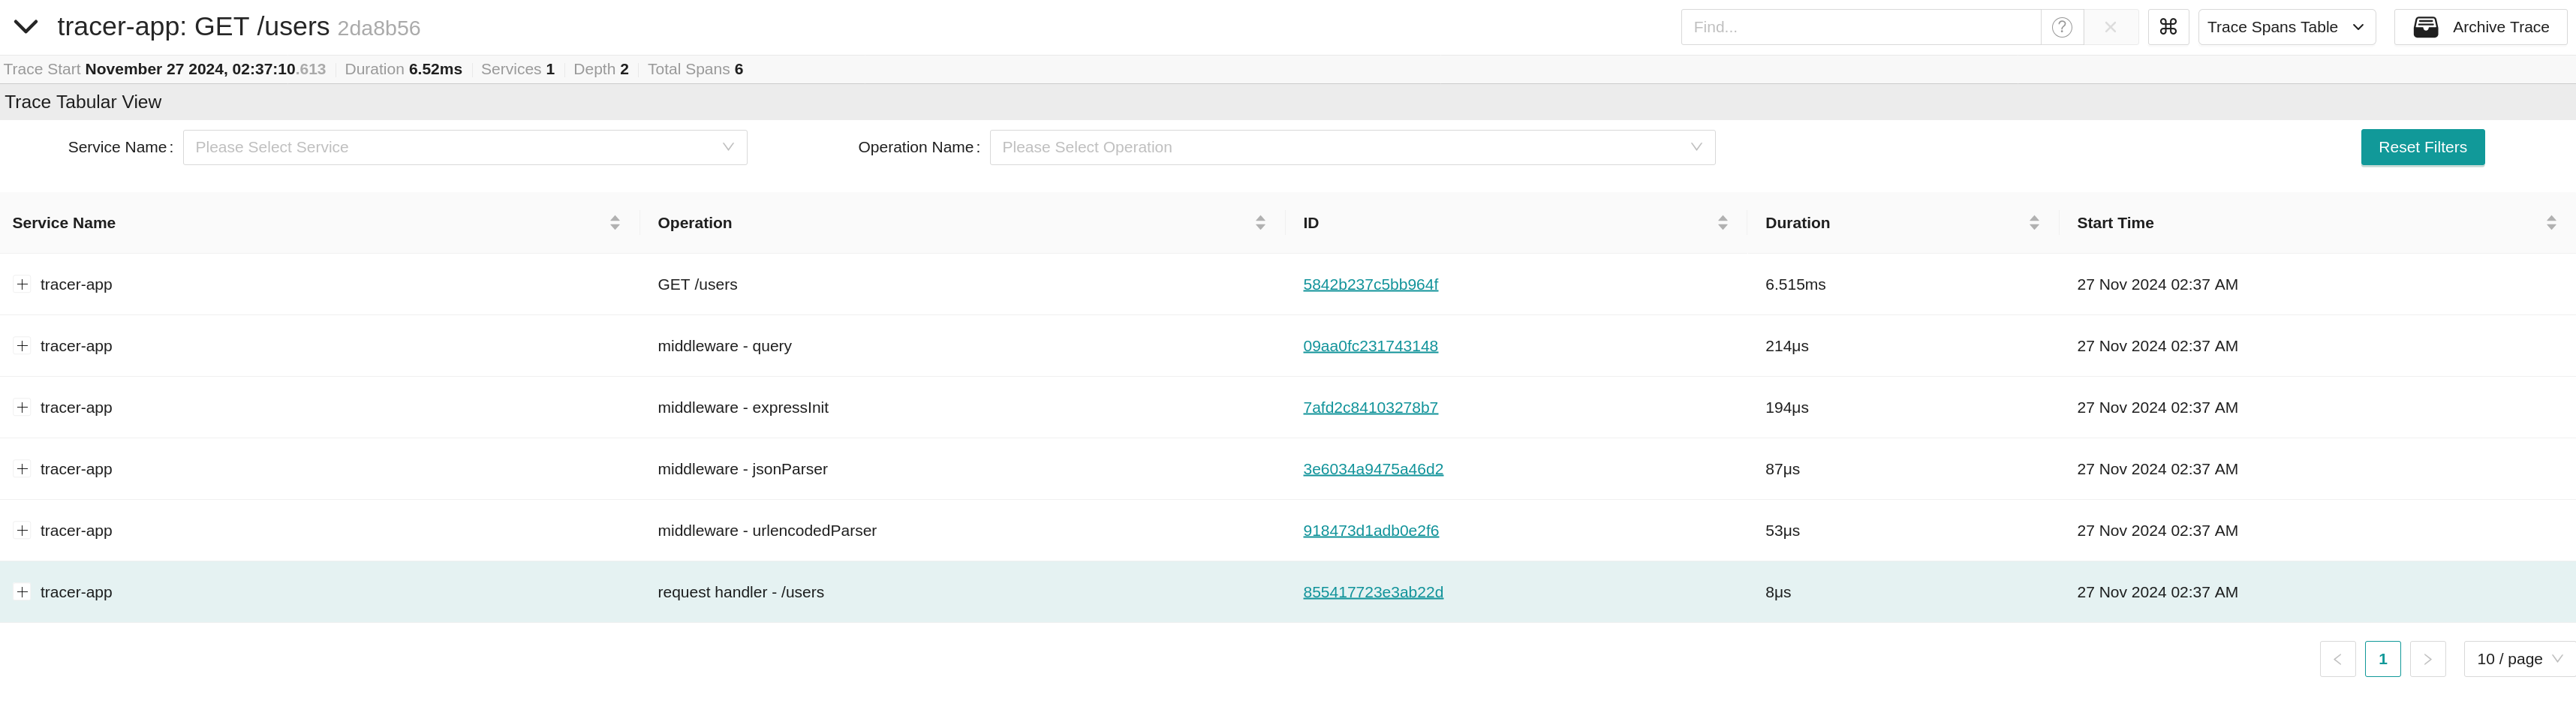
Open your browser and navigate to http://localhost:16686 to access the Jaeger UI. Select tracer-app from the Service dropdown, click Find Traces, and select any trace to inspect the complete span waterfall: